ClickHouse data source plugin for Grafana
With Grafana you can explore and share all of your data through dashboards. Grafana requires a plugin to connect to ClickHouse, which is easily installed within their UI.
1. Gather your connection details
To connect to ClickHouse with native TCP you need this information:
-
The HOST and PORT: typically, the port is 9440 when using TLS, or 9000 when not using TLS.
-
The DATABASE NAME: out of the box there is a database named
default, use the name of the database that you want to connect to. -
The USERNAME and PASSWORD: out of the box the username is
default. Use the username appropriate for your use case.
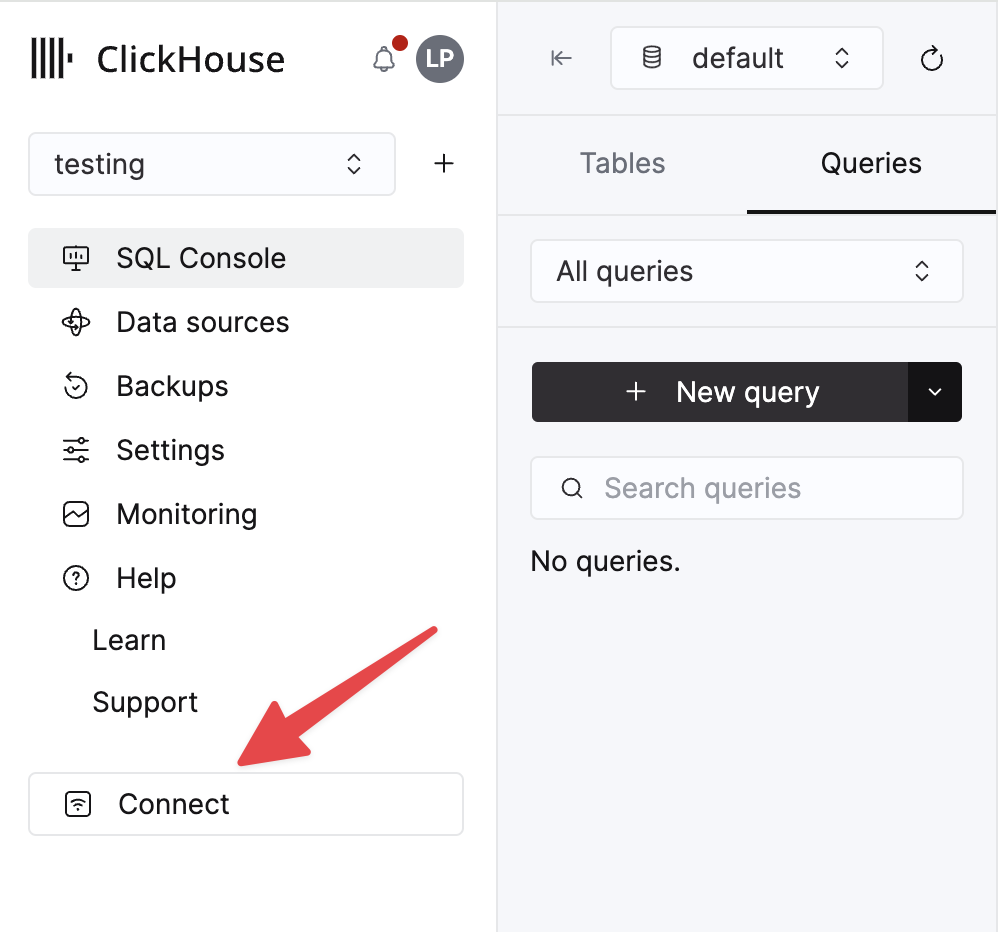
The details for your ClickHouse Cloud service are available in the ClickHouse Cloud console. Select the service that you will connect to and click Connect:
Choose Native, and the details are available in an example clickhouse-client command.
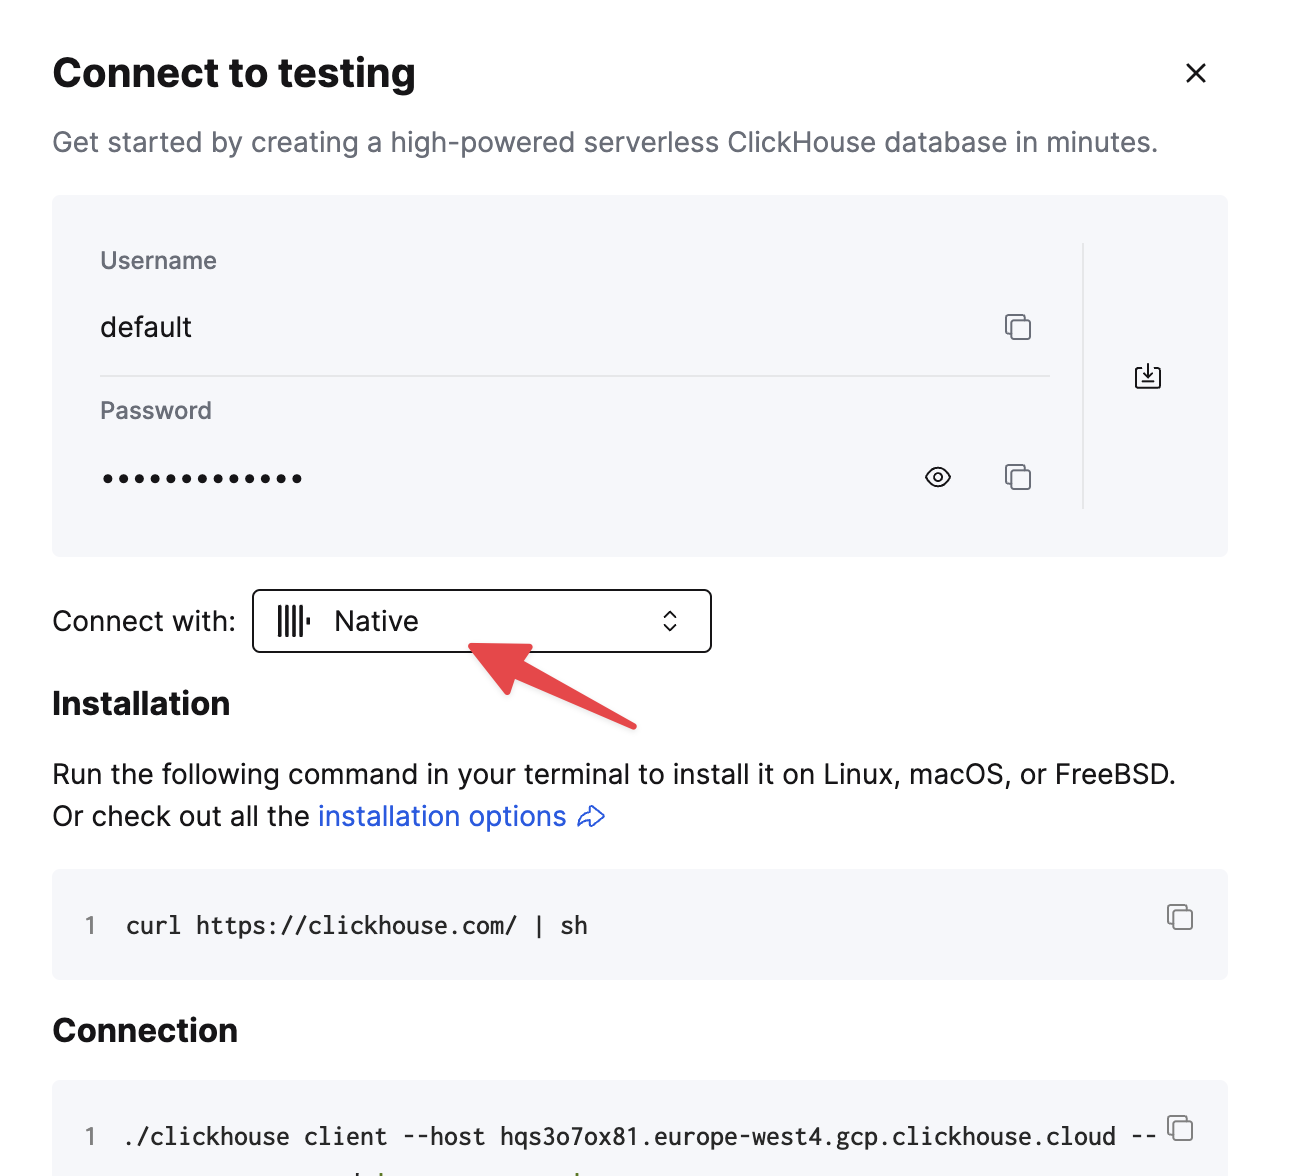
If you are using self-managed ClickHouse, the connection details are set by your ClickHouse administrator.
2. Making a read-only user
When connecting ClickHouse to a data visualization tool like Grafana, it is recommended to make a read-only user to protect your data from unwanted modifications.
Grafana does not validate that queries are safe. Queries can contain any SQL statement, including DELETE and INSERT.
To configure a read-only user, follow these steps:
- Create a
readonlyuser profile following the Creating Users and Roles in ClickHouse guide. - Ensure the
readonlyuser has enough permission to modify themax_execution_timesetting required by the underlying clickhouse-go client. - If you're using a public ClickHouse instance, it is not recommended to set
readonly=2in thereadonlyprofile. Instead, leavereadonly=1and set the constraint type ofmax_execution_timeto changeable_in_readonly to allow modification of this setting.
3. Install the ClickHouse Plugin for Grafana
Before Grafana can connect to ClickHouse, you need to install the appropriate Grafana plugin. Assuming you are logged in to Grafana, follow these steps:
-
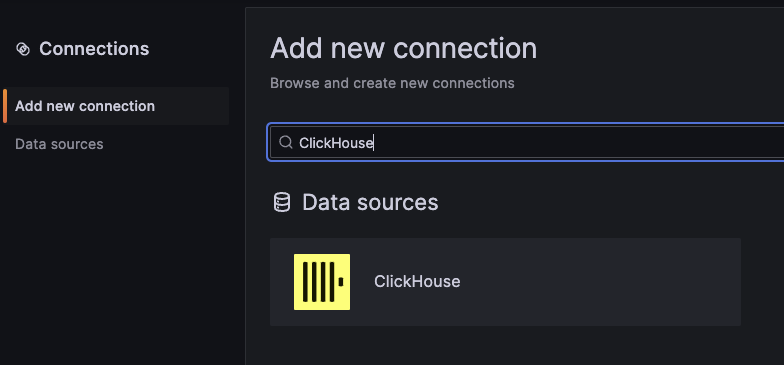
From the Connections page in the sidebar, select the Add new connection tab.
-
Search for ClickHouse and click on the signed plugin by Grafana Labs:
-
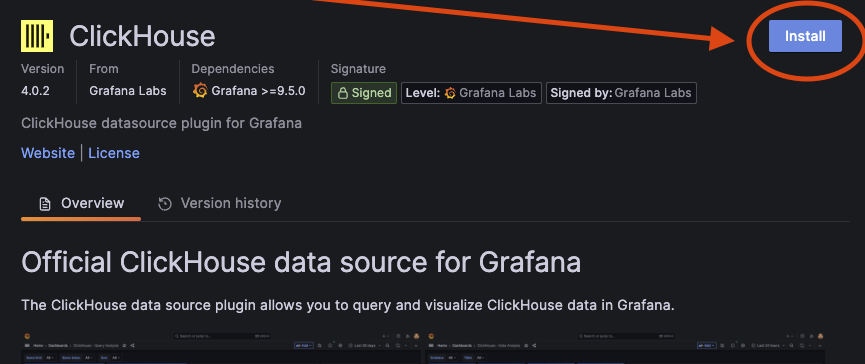
On the next screen, click the Install button:
4. Define a ClickHouse data source
-
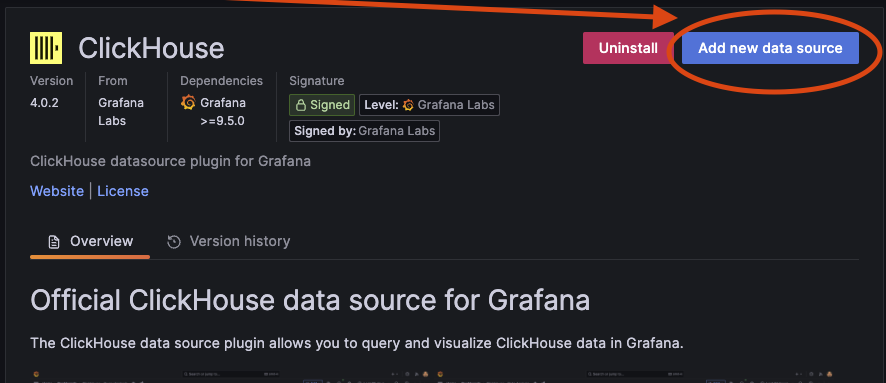
Once the installation is complete, click the Add new data source button. (You can also add a data source from the Data sources tab on the Connections page.)
-
Either scroll down and find the ClickHouse data source type, or you can search for it in the search bar of the Add data source page. Select the ClickHouse data source and the following page will appear:
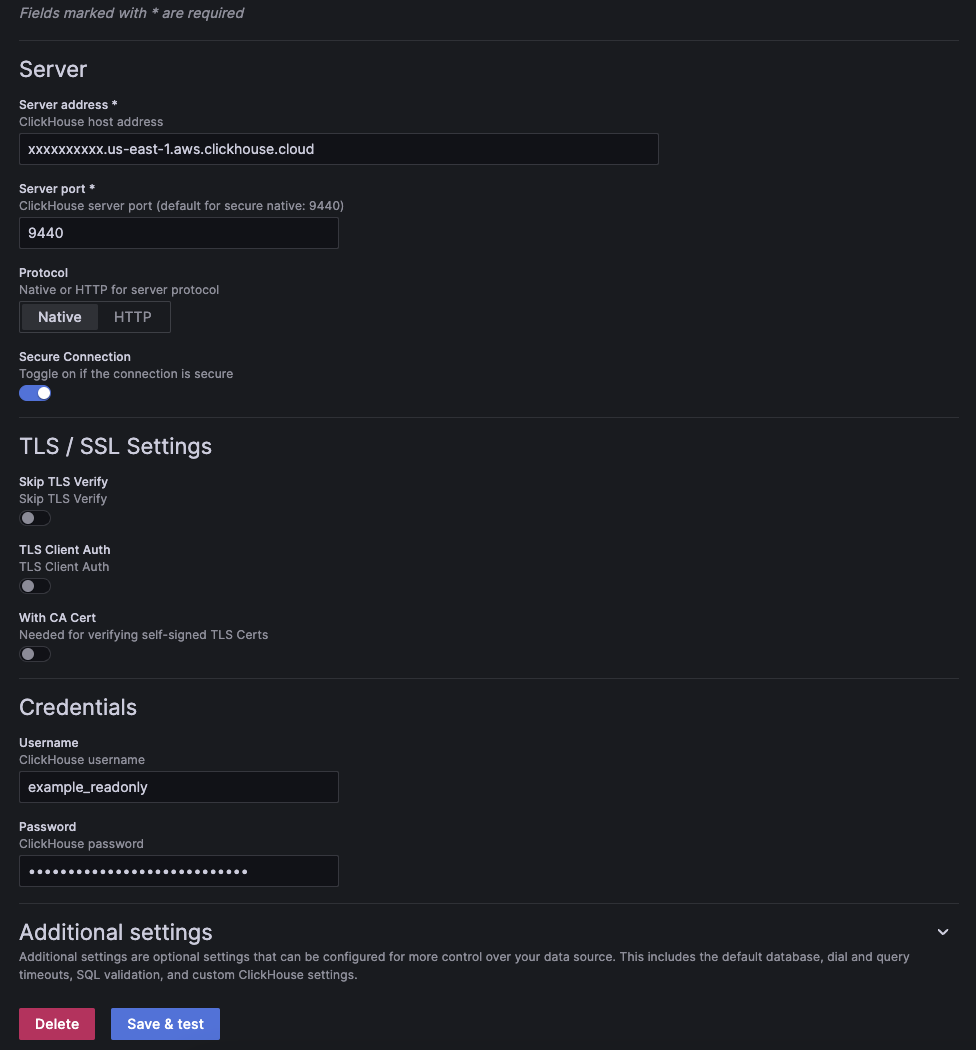
- Enter your server settings and credentials. The key settings are:
- Server host address: the hostname of your ClickHouse service.
- Server port: the port for your ClickHouse service. Will be different depending on server configuration and protocol.
- Protocol the protocol used to connect to your ClickHouse service.
- Secure connection enable if your server requires a secure connection.
- Username and Password: enter your ClickHouse user credentials. If you have not configured any users, try
defaultfor the username. It is recommended to configure a read-only user.
For more settings, check the plugin configuration documentation.
-
Click the Save & test button to verify that Grafana can connect to your ClickHouse service. If successful, you will see a Data source is working message:

5. Next Steps
Your data source is now ready to use! Learn more about how to build queries with the query builder.
For more details on configuration, check the plugin configuration documentation.
If you're looking for more information that is not included in these docs, check the plugin repository on GitHub.
Upgrading Plugin Versions
Starting with v4, configurations and queries are able to be upgraded as new versions are released.
Configurations and queries from v3 are migrated to v4 as they are opened. While the old configurations and dashboards will load in v4, the migration is not persisted until they are saved again in the new version. If you notice any issues when opening an old configuration/query, discard your changes and report the issue on GitHub.
The plugin cannot downgrade to previous versions if the configuration/query was created with a newer version.
Related content
- Plugin Repository on GitHub
- Blog: Visualizing Data with ClickHouse - Part 1 - Grafana
- Blog: Visualizing ClickHouse Data with Grafana - Video
- Blog: ClickHouse Grafana plugin 4.0 - Leveling up SQL Observability
- Blog: Getting Data Into ClickHouse - Part 3 - Using S3
- Blog: Building an Observability Solution with ClickHouse - Part 1 - Logs
- Blog: Building an Observability Solution with ClickHouse - Part 2 - Traces
- Blog & Webinar: A Story of Open-source GitHub Activity using ClickHouse + Grafana

